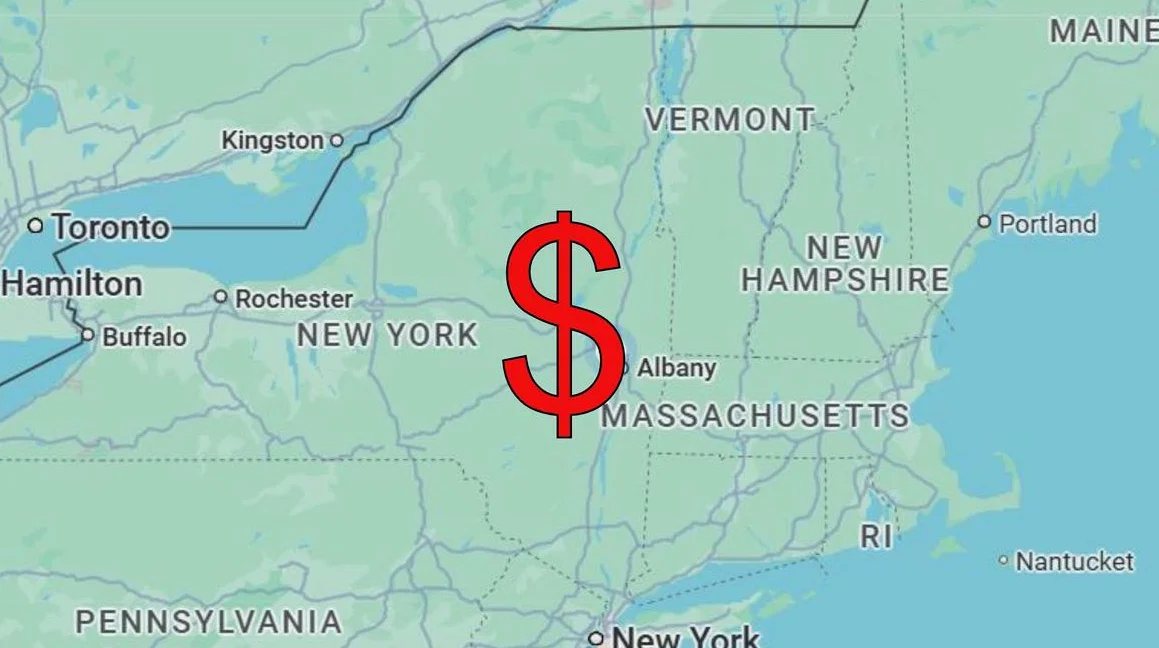
New Yorkers will need more cash for the same goods starting in 2026. A $100 bill in the Empire State purchases only $92 worth of items compared to the national average, data from financial planner Jeff Rose shows.
Rose, a retired Certified Financial Planner and self-made millionaire, crunched numbers on cost-of-living differences across states. His analysis projects how far $100 stretches based on expenses like housing, groceries and transportation. New York’s steep costs erode the dollar’s value faster than in most places.
Pennsylvania offers better bang for the buck right next door. There, $100 holds $104 in buying power. Residents in Mississippi get even more: $118. West Virginia tops the list at $119, according to Rose’s map.
California suffers worst. Its $100 shrinks to $88, the nation’s lowest. New York lands second from the bottom at $92. High rents and food prices drive the losses. Rose points to everyday examples. In pricey states, $100 might cover just a week’s groceries for one person. In cheaper spots, it buys for a family.
"Your parents and school didn’t teach you this," Rose writes on his site. He built his wealth spotting such gaps. Now he shares tips on beating inflation through smart spending and investing.
The projections use 2026 cost forecasts from government data and economic models. They factor regional price indexes from the U.S. Bureau of Labor Statistics. New York’s index sits at 108.2, meaning costs run 8.2% above average. That directly cuts the dollar’s real value to $92.
Other low performers include Hawaii at $89, Massachusetts at $93 and Maryland at $94. On the flip side, Alabama delivers $116 and Arkansas $115. Rose’s full list spans all 50 states, highlighting stark divides between coasts and heartland.
These gaps affect more than shopping. Retirees on fixed incomes feel the pinch hardest in New York. Workers earning the same salary elsewhere pocket more purchasing power. Businesses pricing goods nationally must adjust too.
Rose urges tracking local costs before big moves. "$100 barely buys groceries in some states," he notes. "In others, it stretches far." His map visualizes the spread, with red zones for weak dollars and green for strong ones.
Economists track these shifts yearly. The Council for Community and Economic Research updates its cost-of-living index monthly. Rose’s 2026 outlook aligns with trends showing urban centers losing ground. New York’s value has slipped steadily since 2020 as remote work boomed and prices spiked.
For families, the math adds up fast. A $50,000 salary in West Virginia buys what $59,500 does in New York, Rose calculates. Job hunters weigh this heavily. Tech hubs like San Francisco amplify the effect, but New York holds firm as a pain point.
Rose offers no quick fixes. He pushes building wealth through side hustles and index funds. His map serves as a wake-up call. As 2026 nears, more Americans may rethink where dollars go furthest.


Comments
No comments yet
Be the first to share your thoughts